A Fault That Would Have Gone Undetected Indefinitely
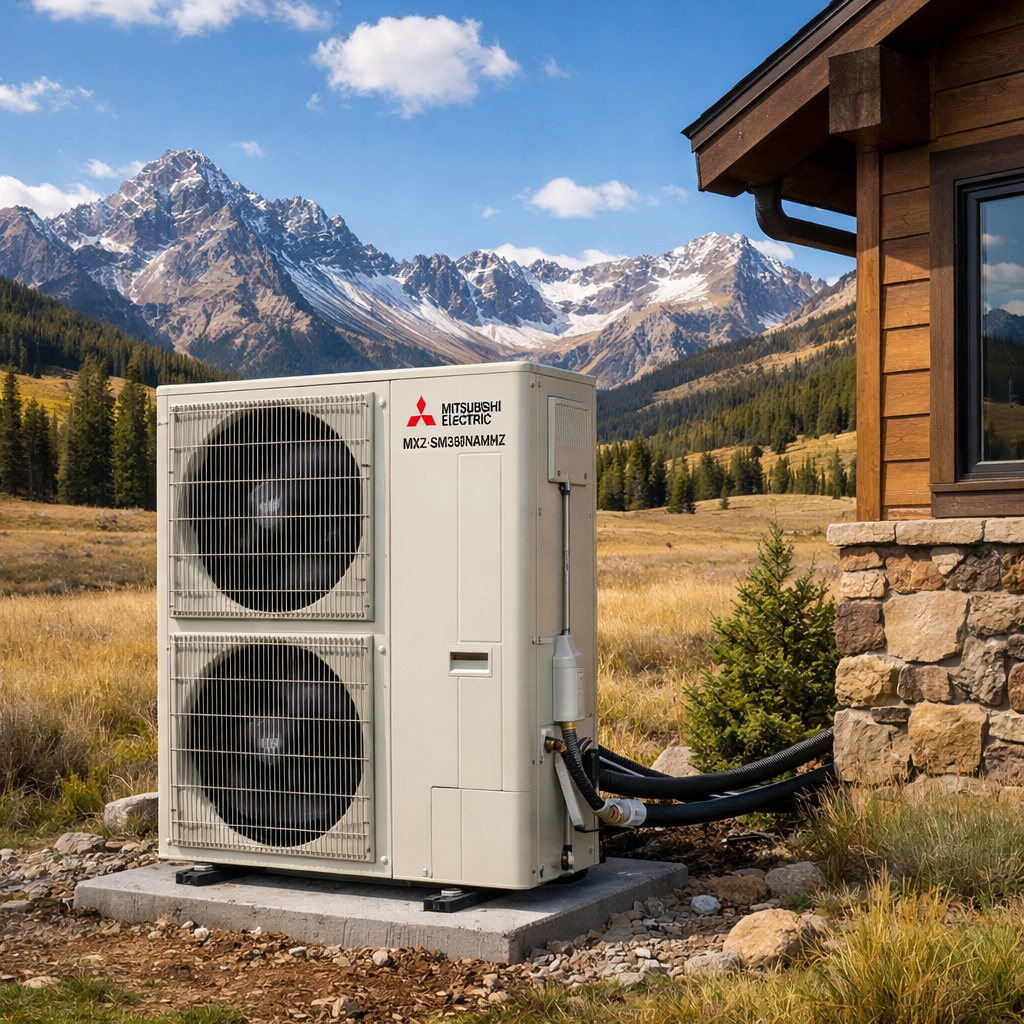
Thalo's continuous cellular monitoring detected anomalous power draw on a Mitsubishi MXZ-SM36NAMHZ VRF heat pump at a Colorado residential deployment. The system flagged abnormal energy consumption patterns before any tenant complaint or visible failure occurred.
Field inspection confirmed a 40% refrigerant undercharge. Without telemetry, this fault would have continued undetected — silently wasting energy and stressing the compressor. Field surveys find 78% of installed systems have charge issues.
Key Results After Correction
- Energy intensity reduced from 1.59 → 1.11 kWh/°F-day (~30%)
- Monthly winter savings of ~480 kWh ($72/mo)
- Avoided emissions of ~1.26 MT CO₂/yr (≈ 3,200 mi driving)
This fault would have gone undetected indefinitely without telemetry. Field surveys find 78% of installed systems have charge issues.
Temperature-Normalized Energy Analysis
Daily kWh was normalized by heating degree-days (base 65°F). Before/after compared via OLS regression with R² goodness-of-fit. Recovery transient (Jan 30–31) excluded. Emissions use EPA eGRID RMPA factor: 1,159 lbs CO₂/MWh.
Colorado's RMPA grid (1,159 lbs CO₂/MWh) is 43% more carbon-intensive than the national average — making every kWh saved here carry outsized climate impact.
What This Means Across 24,000 Units
Assuming 25% of units have charge faults at half this severity: ~7.2M kWh/yr wasted, ~$1.1M/yr excess electricity, and ~3,790 MT CO₂/yr of avoidable emissions — all detectable and correctable through continuous monitoring.
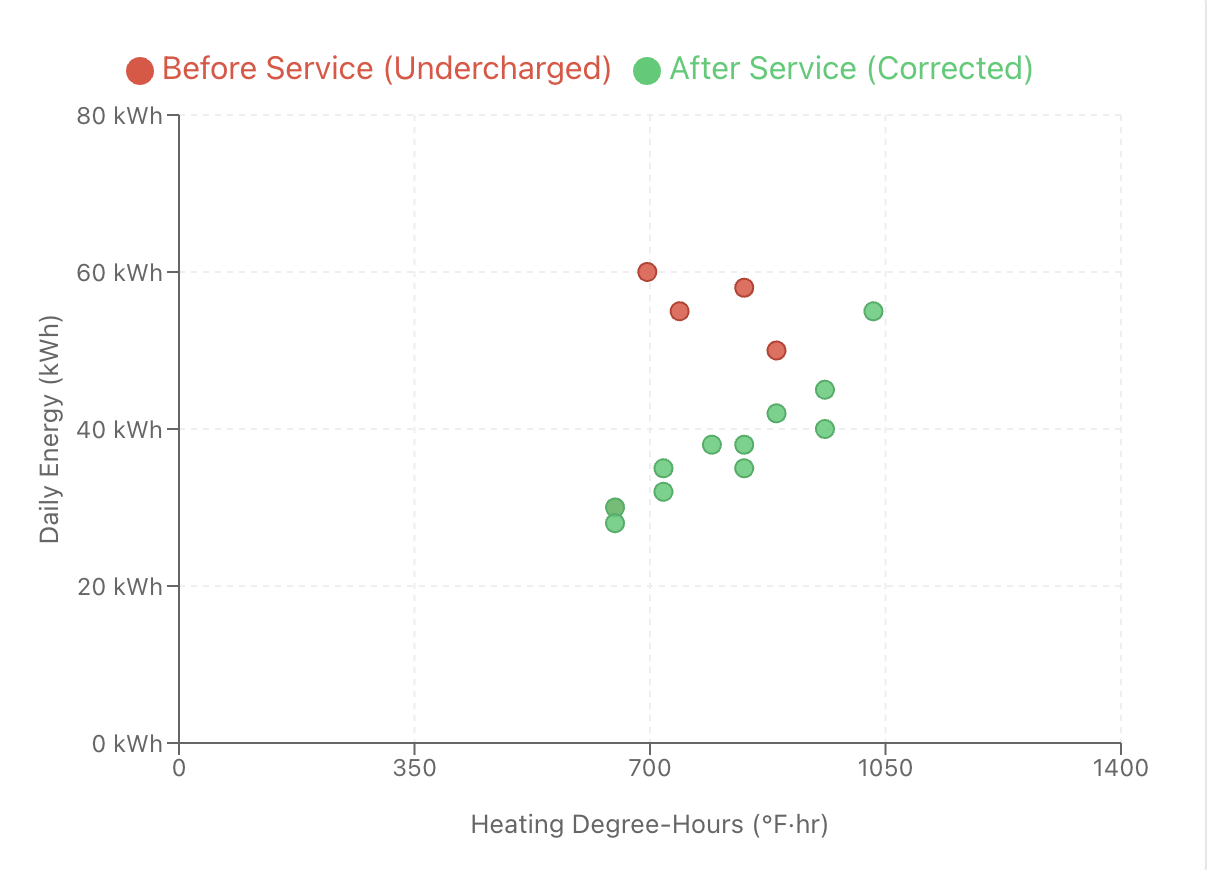
Temperature-Normalized Energy: Before vs. After Service
Each point = one day's energy use vs. heating degree-days (base 65°F). Red = undercharged; Green = corrected.